How Does Poisson Distribution Betting Work?
Poisson Distribution betting uses a mathematical formula to calculate the likelihood of scores or outcomes in sports (mainly football).
It uses data from league averages and specific team’s previous results.
It can be used to work out how many goals a team is likely to score in comparison to their opposition.
Firstly, where did the Poisson Distribution system originate from?
It was devised by a French maths whizz called Simeon Denis Poisson in the 19th century as a way to determine the probability of a number of wrongful convictions occurring in specific countries.
Fast forward a little and it’s used as a probability theory that utilises previous sports data. The objective being to predict the outcome of sports events by working out the likelihood of certain events happening in a fixed period of time.
Sports betting is bigger than ever and all bettors want to get one over the bookies.
Amongst the many betting strategies out there, the Poisson Distribution formula is regarded as a powerful method to work out sports probabilities such as game scores or the number of goals scored.
In this Poisson Distributions in betting guide, we’ll take a look at various aspects of the system including how it works, how it’s applied to sports betting and the limitations of it.
The Poisson Distribution Formula
The Poisson Distribution system is more suited to sports that have continuous action such as cricket, hockey or football.
As football is the number one sport in the UK, our article will mainly focus on the use of the Poisson Distribution in football.
Okay, it’s time to blow some minds. Please bare in mind that a mathematician came up with this. What is the Poisson Distribution formula?

It all looks like Double Dutch to us but don’t worry, we’ll find a way to clear the fog!!
Why The Poisson Distribution Is Important
When the bookmakers pick the odds to offer customers, they don’t pluck a figure out of the air.
They employ a team of experts who use algorithms to determine the right odds, yet still build in a house edge for themselves. Clever right!
There’s no reason that you can’t take a similar approach to the bookies and look at the maths side of things.
Why not work out the possibilities of events happening in a game for yourself.
The key to increasing your chances is to find value bets.
If you can get ahead of the bookies and find or work out the likelihood of something happening before they do, you’ve got your value right there.
Why Should You Use The Poisson Distribution In Sports Bets?
Most sports bettors don’t consider the correct probability of a bet being successful.
Intuition and emotional bettings is unreliable and carries no quantitative thoroughness.
The Poisson Distribution can provide the following:
- Fact Based: You can calculate the probability of specified outcomes by using historical data.
- Removes Bias: The system provides objectivity because you’re basing your bets on maths and data rather than intuition.
- Market Comparisons: You can use the Poisson Distribution to compare your figures against the bookies odds to identify any value bets.
Using Poisson Distribution To Calculate Football Events
The Poisson Distribution is often used to work out the probability of match scores in football, along with whether the game will be a win, loss or draw.
Calculating Goal Expectancy
To calculate the goal expectancy of a football team, you need to know the attack and defence strength of that team and the same for the opposing team.
In this example, let’s use the official data from the 2023/2024 Premier League season.
We will choose a hypothetical match between Man City and Arsenal with Man City being the home team.
Before we can calculate the goal expectancy, we need to gather some data:
General:
- All home goals scored by all the teams for that season
- All away goals scored by all the teams for that season
- The average home and away goals per game for all teams
Man City
- Average goals scored at home per game for that season
- Average goals conceded at home per game for that season
Arsenal
- Average goals scored away per game for that season
- Average away goals conceded per game for that season
| Home goals by all team | Away goals by all teams | Man City home goals | Man City goals conceded at home | Arsenal Goals away | Arsenal goals conceded away | |
| Goals | 684 | 562 | 51 | 16 | 43 | 13 |
| Matches | 380 | 380 | 19 | 19 | 19 | 19 |
| Match Average | 1.8 | 1.479 | 2.68 | 0.84 | 2.26 | 0.68 |
We can now use these figures to progress on to work out the attack and defence strengths.
By the way, you can get these sorts of stats from websites like the official Premier League site or FootyStats.
Attack Strength
The attack strength is calculated by dividing a team’s average number of goals at home or away by the average number of goals at home or away for the league.
Using our example, this would provide the following information:
Man City (Home Team)
Attack Strength: 2.68 / 1.8 = 1.49
Arsenal (Away Team)
Attack Strength: 2.26 / 1.479 = 1.53
Defence Strength
Equally as simple as the attack strength calculation. However, this time we are using the team’s average number of goals conceded and dividing it by the average number of goals conceded for the league.
Still using the same example, this is the defence strength of Man City and Arsenal:
Man City (Home Team)
Defence Strength: 0.84 / 1.479 = 0.57
Arsenal (Away Team)
Defence Strength: 0.68 / 1.8 = 0.38
Goal Expectancy
Now we have calculated the attack and defence strengths of Man City and Arsenal, we can determine the goal expectancy for both:
Man City’s Goal Expectancy
In order to calculate the probability of how many goals Man City will score, you need to follow the following calculation:
Man City’s attack strength x Arsenal’s defence strength x Premier leagues average home goals which gives us the following:
1.49 x 0.38 x 1.8 = 1.02
Arsenal’s Goal Expectancy
In order to calculate the probability of how many goals Arsenal will score, you need to follow the following calculation:
Arsenal’s attack strength x Man City’s defence strength x Premier leagues average away goals which gives us the following:
1.53 x 0.57 x 1.479 = 1.29
Average goal expectancy in the match:
Man City - 1.02
Arsenal - 1.29
Calculating Possible Scores Using The Poisson Distribution Formula
You saw the mathematical equation for the Poisson Distribution and I don’t know about you, but it looked like hard work. Calculations in betting can be complex when you start ramping up bet combinations such as the Heinz bet in horse racing.
The Poisson Distribution is no different in terms of complexity. We always recommend using online calculators in such scenarios as it avoids any manual errors.
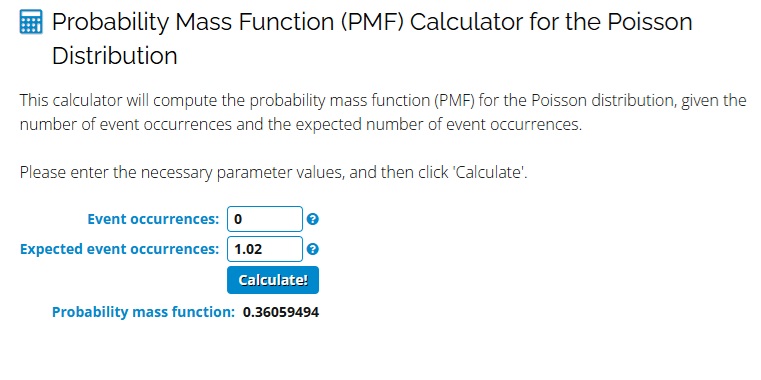
Let’s give it a whirl using this online calculator.

So the above calculator shows the probability of Man City scoring no goals but where do the figures come from?
In the ‘Event occurrences’ you enter the goals amount and in the ‘Expected event occurrences’ you enter the average goal expectancy figure.
So, in the above image we have zero as the amount of goals Man City will score (Expected occurrences) and 1.02 as the average goal expectancy (Expected event occurrences).
You can repeat this calculation for any amount of goals for either Man City or Arsenal but make sure you enter the correct goal expectancy figure. That said, we recommend you don’t go above 5 goals.
Based on using 5 goals and the already established goal expectancy, how do the figures stack up:
| Man City Goals | Probability |
| 0 Goals | 0.36059494 |
| 1 Goal | 0.36780684 |
| 2 Goals | 0.18758149 |
| 3 Goals | 0.06377771 |
| 4 Goals | 0.01626331 |
| 5 Goals | 0.00331772 |
| Arsenal Goals | Probability |
| 0 Goals | 0.27527078 |
| 1 Goal | 0.35509931 |
| 2 Goals | 0.22903906 |
| 3 Goals | 0.09848679 |
| 4 Goals | 0.03176199 |
| 5 Goals | 0.00819459 |
Based on the highest being 5 goals, this is how the probabilities look from 0 - 0 up to 5 - 5.
The Probability Table

Table key:
- Grey: Potential goals for Man City and Arsenal
- Blue: Poisson Distribution probability for the number of goals for both teams
- Green: Probability for different winning margins for Arsenal
- Purple: Probability for different winning margins for Man City
- Yellow: Probability of combinations of a draw
Looking at the above table, we can see that the most likely outcome is 1 - 1 (the highest probability figure) followed by 1 - 0 to Arsenal.
So, now we know what the most likely outcome of the match might be. Obviously, there are no guarantees with this as it’s using historical data and this doesn’t factor in injuries, new player signing etc.
How Do The Bookies Use This Information?
The Bookmakers use Poisson Distribution to determine the probabilities in various markets and then convert that into odds. Let’s have a look at how they do that:
- Man City Win: To work out the chance of Man City winning, you need to add all of the sums in the purple cells from the above probability table. The total of those figures is 0.2998 or 29.98%.
- Arsenal Win: Similar to the Man City calculation but this time, you’re adding up all the green cells from the probability table. The total of those figures is 0.42719 or 42.72%.
- The Draw: This time you add up all of the yellow cells. Again, using the above table that provides a figure of 0.28433 or 28.43%.
To determine the odds, you use the figures rather than the percentages and divide 1 by the probability figure. Please note, this provides the answer in decimal odds rather than fractional. Decimals are easier to use and are the go to for Matched Betting. You can convert the decimal odds to fractional here if you prefer.
This breaks down to the following odds:
- Man City Win: 1 / 0.2998 = 3.33
- Arsenal Win: 1 / 0.342719 = 2.92
- Draw: 1 / 0.28433 = 3.52
Want To Create Your Own Poisson Distribution Spreadsheet For Football?
All of these formulas and figures might seem a bit daunting but it’s not too difficult to create your own spreadsheet calculations in Excel.
Follow our guide below to get started.
Step 1: You need to find out your team’s expected goals. This is done by multiplying a team’s attack strength by the opposition's defence strength by the average goals per match.
As a reminder, these calculations are covered in our above section Goal Expectancy. In this example, we’ll use the data we created for Arsenal earlier in the article.
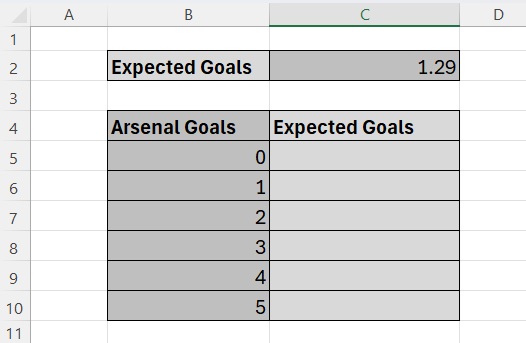
Step 2: Use Excel to create the below table:

Step 3: Enter the formula into the spreadsheet.
To do this, click in the cell to the right hand side of 0 goals (cell C5). Then click on the ‘Formulas’ tab at the top and click on the ‘Insert Function’ option.
Once you click on the ‘Insert Function’ option it will open a new dialogue box. You then need to type Poisson into the search box and click Go.
This will then look like the below:

Highlight the POISSON DIST function and click OK.
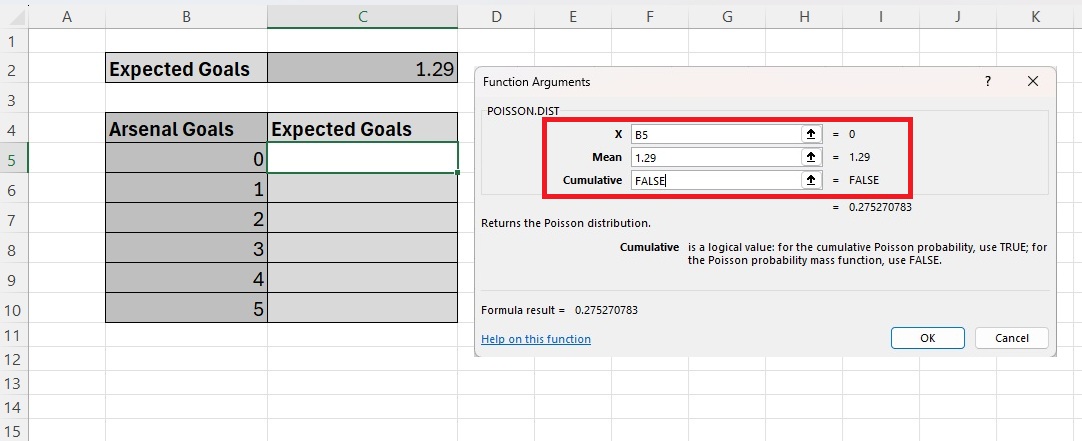
You will then get a ‘Function Arguments’ dialogue box with three input boxes to complete. Insert the following:
- X - enter B5 (or you can click on the goals cell to the left)
- Mean - enter 1.29 (this is whatever your team’s expected goals is)
- Cumulative - enter FALSE
You screen should then look like this:

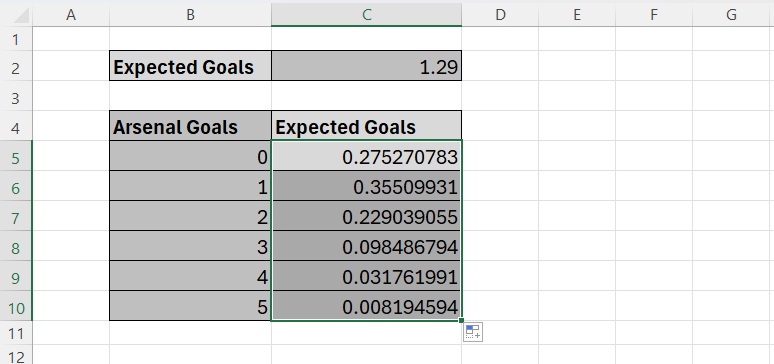
This will give you Arsenal’s goal expectancy for zero goals. In order to get the goals expectancy for goals 1 to 5, click on the plus sign at the bottom right of cell C5 (zero expected goals) and drag the cursor down to cell C10 (expected goals 5). Your table should now look something like this:

This now provides you with the Poisson Distribution for 0 to 5 goals based on Arsenal’s expected goal average which is 1.29.
There’s nothing stopping you from doing the same system of other teams in the same sheet. This would allow you to compare goal expectancies on o to 5 goals. Thai can be particularly useful when comparing figures of two teams playing each other.
Advantages Of Using Poisson Distribution For Betting
- It helps you understand how the bookies determine their odds.
- You can create your own Poisson Distribution and compare the odds to the bookies.
- Gives you the formulated odds which might be more reliable than the market odds if punters push the odds up or down with large bets.
- The method is mainly used for football but can be used on other sports.
- Poisson Distribution provides you with facts rather than subjective thoughts and opinions of industry experts.
Drawbacks To The Poisson Distribution System
- The system uses historical data so it doesn’t account for injuries, new player signings, new managers etc. These factors can enhance or hinder a team’s chances of winning. This means if you wanted a more up-to-date set of data, you’d need to wait for quite a few games of the current season to be played to get more applicable data.
- The Poisson Distribution model is based on previous results which may or may not have been representative of what happened in a game. For example, Liverpool could totally dominate a game with 90% possession and then Chelsea score in the 91st minute. This type of thing would be unlikely to happen twice.
- The model is based on averages and teams don’t always score at a rate that is constant. This can skew the figures a little.
- The Poisson Distribution system is designed more for lower scoring sports so you’re limited on how many types of sports you should use it with.
Recap On Calculations Needed For The Poisson Distribution
Attack Strength
- A team’s average number of goals (home or away) divided by the average number of goals for the league (home or away).
Defence Strength
- A team’s average number of goals conceded (home or away) divided by the average number of goals conceded for the league (home or away).
Goal Expectancy
- Attack Strength of Team A x Defence Strength of Team B x the league average number of goals.
Calculating Odds
- To calculate the odds of a team winning, you need to add up the sums for that team from the Probability Table. Using our previous example, you would add all the figures in the Purple cells. The total for Man City to win was 0.2998. The odds are calculated by dividing 1 by the 0.2998.
- 1 / 0.2998 = 3.33 odds or ⅓ if using fractional odds
A Fun Analogy Of The Poisson Distribution Method

Imagine meeting up with a friend and telling him you’ve been using Poisson Distribution to place informed bets. They would probably look at you like you were from Mars.
Here’s a very high level way to explain it:
You know the cookie monster adores cookies but you have no idea how many he could eat in one hour. It’s a little like ‘how long is a piece of string’ when it comes to guessing.
The Poisson Distribution approach is a special tool to make your guess more accurate. When used correctly, it will provide you with the figures that can identify if he’s likely to eat 0, 1, 2, 3, 4 or more cookies in an hour.
The same system can be applied to sports and sports betting. You can use it to make informed guesses on which football team might win a match, how many goals a team or teams might score or estimate a cricket team’s total run score.
Summary
The Poisson Distribution is a reliable model for betting on sports and is better suited to low scoring events like football. By using the method and utilising past data, you can improve your chances of success with your bets.
It can provide you with a better knowledge of game probabilities and can even help in identifying value bets.
However, as with any betting models or betting strategies, it does have limitations and does not guarantee success.
Having knowledge of the logic behind betting odds gives you the opportunity to get ahead of the bookies and beat the house edge.
Next time you’re watching the footy, remember the Poisson Distribution model. It could make your guesses a bit more realistic!
Updated: 30 Dec 2024
The Author
Paul brings over four years of Matched Betting experience to Outplayed. His extensive background in financial services and e-commerce, combined with his expertise in online marketing and Matched Betting, makes him a valuable asset to the team.

